Kubernetes GPU Waste: It’s Complicated.
Kubernetes was built for CPUs and RAM. Its native metrics glance at pods, nod to allocations, and declare ‘all clear.’ They tell you a GPU is assigned. They don’t tell you if it’s doing anything remotely useful. This is the foundational problem. Your dashboards might be green, your kubectl top output pristine, but behind the scenes, a substantial chunk of your GPU investment—we’re talking 20-40% here—is likely doing nothing but costing you money. It’s the digital equivalent of leaving the lights on in an empty mansion.
The subtle art of GPU waste in Kubernetes isn’t typically announced with klaxons. It’s insidious.
The Silent Drain: How GPUs Go Idle (and Cost You)
You’ve got your standard suspects, the usual culprits that fly under the radar of Kubernetes’ built-in monitoring. First, there’s idle allocation. A pod simply holds onto a GPU resource without actively performing inference or training. Background processes might keep its utilization from hitting zero, painting a deceptive picture of activity. Then, tier misplacement. Imagine running a lightweight model on a powerhouse H100; it’s like using a sledgehammer to crack a walnut. The GPU appears busy, but you’re massively overspending for the actual work being done, consuming far more memory bandwidth than necessary. And the dreaded CPU-bound stall: your GPU is chomping at the bit, ready to compute, but it’s stuck waiting for data preprocessing, tokenization, or data loading to finish. GPU utilization might read high, but actual throughput plummets. Don’t forget KV cache pressure, where context window growth can degrade performance without a corresponding drop in utilization, and orphaned workloads—those experiments, notebooks, or test deployments that were meant to be ephemeral but now sit idle, hogging valuable GPU allocations indefinitely.
These scenarios are perfectly benign from the Kubernetes scheduler’s perspective. Resource allocated? Check. Pod running? Check. But they all translate to real, tangible dollar signs evaporating.
Beyond nvidia-smi: The Need for Deeper Telemetry
Relying solely on nvidia-smi or standard Kubernetes node metrics is like trying to diagnose a complex illness with just a thermometer. You need more granular, GPU-specific data. This is where NVIDIA’s Data Center GPU Manager (DCGM) exporter comes in. Deploying it as a DaemonSet is your first step to unlocking these deeper insights.
helm repo add gpu-helm-charts https://nvidia.github.io/dcgm-exporter/helm-charts
helm install dcgm-exporter gpu-helm-charts/dcgm-exporter
This little utility beams per-GPU metrics into Prometheus at a brisk 1-second resolution, giving you the raw material for detecting waste. Key metrics to watch include DCGM_FI_DEV_GPU_UTIL (the actual compute work happening), DCGM_FI_DEV_MEM_COPY_UTIL (data movement efficiency), DCGM_FI_DEV_FB_USED (VRAM consumption), and crucially, DCGM_FI_DEV_POWER_USAGE. A GPU that’s slurping power but showing low compute utilization is a screaming siren of waste.
Setting the Waste Thresholds: Spotting the Red Flags
For inference workloads, establishing clear thresholds is critical. Think about a GPU showing less than 20% SM utilization over a 10-minute average—that’s a strong waste signal. Similarly, memory bandwidth below 30% or a GPU drawing over 80% of its TDP while staying below 20% SM utilization are clear indicators. And the ultimate no-no: an allocated GPU with zero requests for more than 15 minutes. A GPU pegged at 5% SM utilization but drawing 400W on an H100? That’s an easily quantifiable $4-$8 per hour drain, and across a fleet, it quickly becomes a budget black hole.
The most glaring waste signal, of course, is a pod that’s clinging to a GPU resource without any active compute. A simple Prometheus query can surface these digital barnacles:
(
kube_pod_container_resource_requests{resource="nvidia.com/gpu"} > 0
) unless on(pod, namespace) (
DCGM_FI_DEV_GPU_UTIL > 5
)
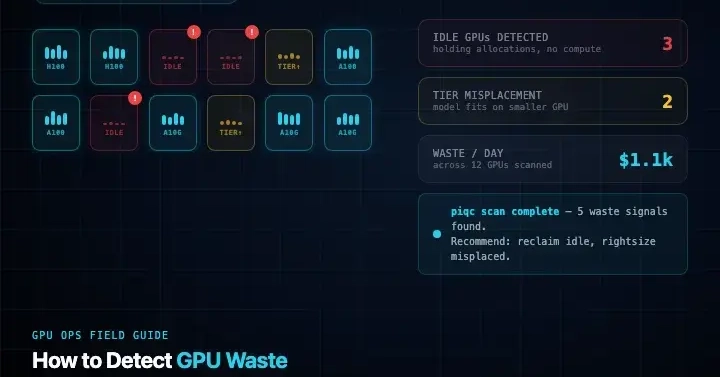
This query targets pods requesting GPUs whose actual utilization is languishing below 5%. The results often surprise—and dismay—teams. For a quick, cluster-wide scan without diving deep into Prometheus, tools like piqc (a fascinating open-source GPU waste scanner) can provide an immediate estimate of your daily waste in dollars.
Tier Misplacement: The Illusion of Busyness
Tier misplacement is trickier. The GPU looks busy, but the underlying architecture is being used inefficiently. A 7-billion parameter model at FP16 needs about 14GB of VRAM. Slap that onto an A10G (24GB) and you’re good; it costs about $1.10/hour. Put that same model on an H100 (80GB) and you’re suddenly looking at $3.50-$4.50/hour for the same work. That’s a $2-$3 per hour waste per GPU, with zero throughput gain. The key here isn’t just utilization numbers; it’s understanding what is running on each GPU, its memory footprint, and whether it’s on the appropriate hardware tier.
This is where model-aware tooling, like Paralleliq’s Introspect, becomes invaluable. It maps workloads to specific models, helps determine the right hardware tier, and quantifies misplacement not as an abstract utilization figure, but as a direct cost delta.
When Throughput Tells the Real Story
If your GPU utilization is hovering in that moderate 40-70% range, yet your expected throughput is mysteriously absent, the GPU is likely bottlenecked somewhere upstream. Adding CPU metrics to your dashboard becomes essential. A high CPU request saturation (above 90%) coinciding with moderate GPU utilization strongly suggests the GPU is waiting on CPU-bound tasks.
The core insight here? Kubernetes, by its nature, abstracts away hardware specifics. When dealing with specialized accelerators like GPUs, this abstraction can become an expensive blind spot. The underlying architecture and the nuances of workload placement are what dictate true efficiency, not just simple allocation counts. It’s a architectural shift that requires a deeper observational layer than Kubernetes was initially designed to provide.
Why This Matters for the Open Source Ecosystem
The tooling described here—DCGM exporter, Prometheus, and community projects like piqc—are largely open-source or built upon open-source foundations. This democratization of observability is critical for the broader AI and ML ecosystem. As more organizations adopt large-scale GPU deployments, being able to precisely measure and mitigate waste becomes not just a cost-saving measure, but a sustainability imperative. Wasted compute is wasted energy, and in an era increasingly focused on environmental impact, efficient resource utilization is paramount. The ability to granularly inspect GPU performance and identify misallocations without proprietary vendor lock-in empowers developers and operators to optimize their infrastructure, fostering a more responsible and efficient use of these powerful, yet costly, resources.
🧬 Related Insights
- Read more: Invisible Code in Cat Faces? [The Web’s Secret Stash]
- Read more: The Power of Silence: Ownership Drives Data Success
Frequently Asked Questions
What does dcgm-exporter do?
dcgm-exporter collects detailed telemetry from NVIDIA GPUs, exposing metrics like utilization, memory usage, and power draw to systems like Prometheus for monitoring and analysis.
How can I quickly check for GPU waste?
Tools like piqc can scan your Kubernetes cluster in under a minute to identify idle GPUs, misplaced workloads, and estimate daily waste in dollars.
Will this help me if I don’t use NVIDIA GPUs?
The methods discussed, particularly DCGM exporter and its specific metrics, are designed for NVIDIA hardware. However, the general principles of monitoring GPU utilization, memory usage, and power draw to identify waste are applicable to other GPU vendors, though the specific tooling would differ.