One Docker Command Conquers Manticore Search Slowdowns
Databases don't crash; they just crawl. Manticore Search's new Grafana dashboard turns detective work into dashboard glances.

⚡ Key Takeaways
Worth sharing?
Get the best Open Source stories of the week in your inbox — no noise, no spam.
Originally reported by Dev.to
Related Stories

DevOps & Infrastructure
Kubernetes Just Killed Ingress NGINX: Half Your Clusters Are Suddenly Vulnerable

DevOps & Infrastructure
GKE's Quiet Domination: Scaling Agentic AI Without the Hype
DevOps & Infrastructure
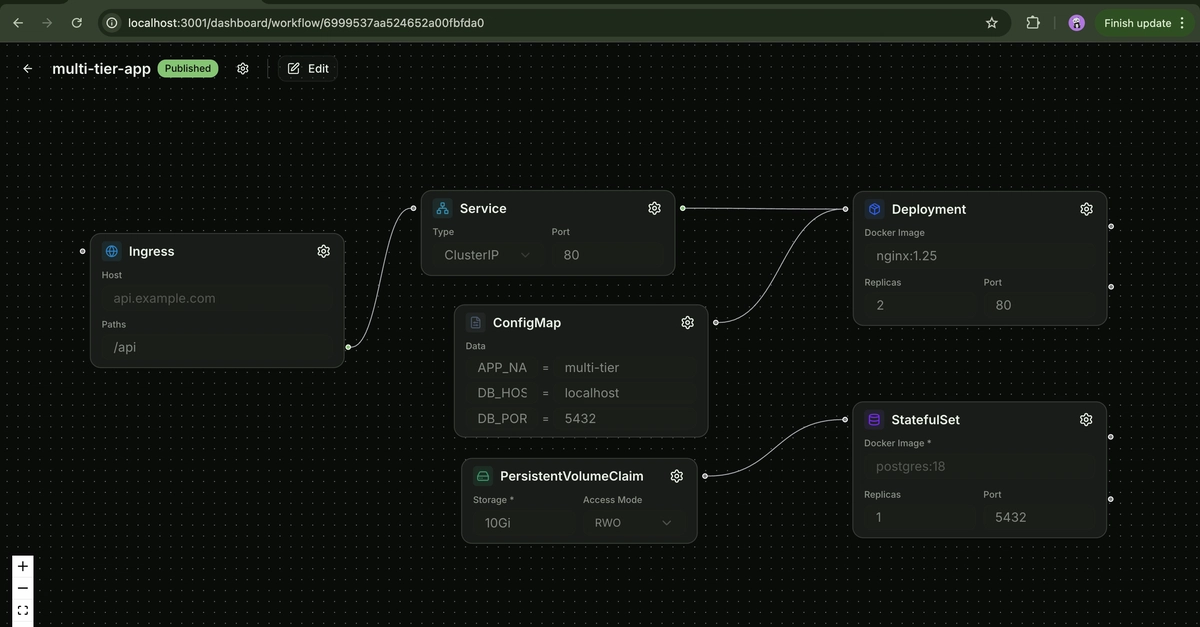
KubeOrch: Drag, Connect, Deploy — Kubernetes Without YAML Hell

DevOps & Infrastructure