The AI world is buzzing, but let’s talk about the engines driving it. We’ve all been sold the dream of intelligent agents, tireless digital assistants that can code review, draft changelogs, and even summarize Slack channels. The marketing pages paint a picture of pure efficiency, a smoothly flow of intelligence. And for the most part, that’s been our reality. We’ve seen these tools get smarter, faster, and more capable with each iteration.
But what happens when the shiny new AI platform shift starts eating your budget alive? What if those sleek, efficient agents are secretly — and expensively — hoarding resources? That’s the scenario one developer found themselves in, staring at a hefty Anthropic invoice and wondering where, exactly, all those tokens were going. It’s like discovering your sleek electric car is secretly guzzling gas in a hidden compartment.
The Case of the Disappearing Tokens
The premise is simple: a production Claude agent, designed for code review, changelog drafting, and Slack summarization, was a token-devouring monster. We’re talking 5.2 million tokens a month. Now, the agent’s logs might say a particular PR was reviewed in X turns with Y tokens, but when you multiply that out, it just doesn’t add up to the gargantuan invoice. The math simply wasn’t working, hinting at a deeper, hidden problem lurking beneath the surface of aggregated metrics.
This isn’t about a complex, exotic AI setup; the agent’s tasks were decidedly un-exotic. Nothing that would warrant a marketing banner. Yet, the bill told a different story. It was a classic case of the ‘black box’ problem, where you see the input and the output, but the chaotic, expensive journey in between remains shrouded in mystery.
So, what did our intrepid developer do? They did what any good engineer would do when faced with a mystery: they turned on the logging. Not just basic logs, but per-call tracing. For a full 30 days, they meticulously captured every whisper and shout of their agent’s internal monologue. And boy, did they find gold.
Unearthing the Hidden Costs: Bottleneck by Bottleneck
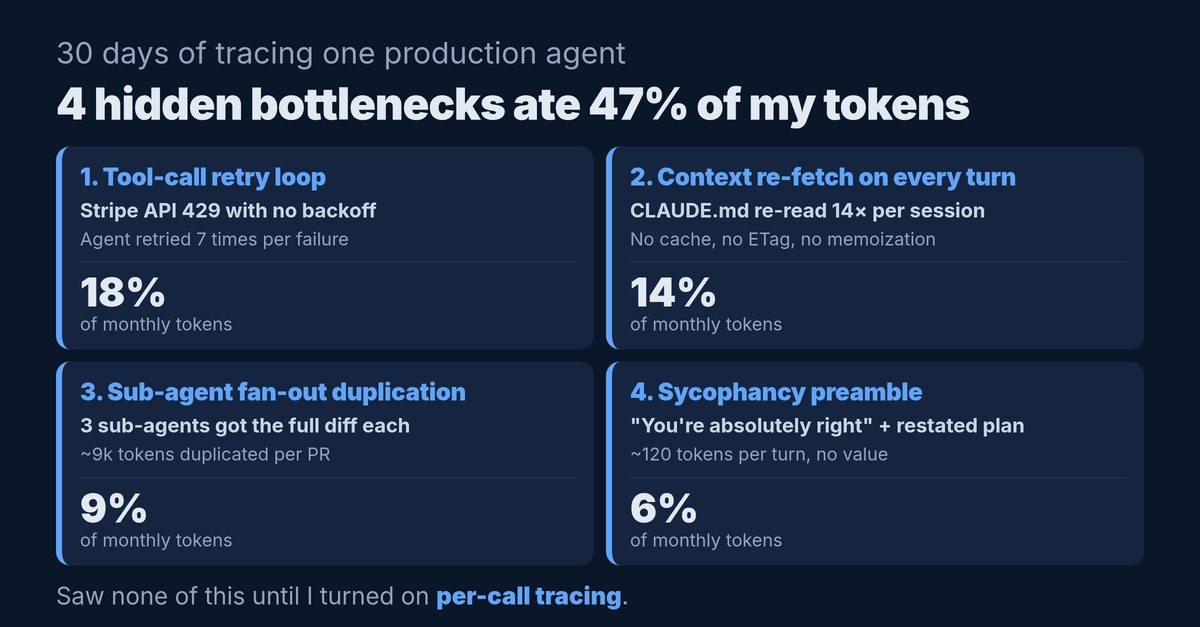
By the end of that tracing period, four distinct bottlenecks had surfaced – issues that the agent’s standard logs were structurally incapable of revealing. These weren’t minor glitches; collectively, they were a ravenous beast, gobbling up a staggering 47% of the monthly token bill without adding a single iota of new behavior or functionality. Fixing them, the report states, quite literally cut the bill in half. That’s like finding a leak in your roof that’s been draining your bank account, and then simply patching it.
This isn’t just about saving money, though that’s a fantastic perk. It’s about understanding the fundamental mechanics of how these powerful AI systems operate at a granular level. It’s about peeling back the layers of abstraction and seeing the real-time, real-cost interactions that underpin our increasingly AI-driven workflows.
The setup for this detective work was intentionally minimal, aiming for ‘ground truth’ without drowning in data: one span per LLM call (with key attributes like model, input/output tokens), one span per tool call (detailing server, duration, errors), one span per ‘agent turn’ to wrap both LLM and tool actions, and trace IDs meticulously threaded to group by the originating task. OpenTelemetry, the standard bearer for distributed tracing, was the weapon of choice, paired with Pydantic Logfire for its native understanding of GenAI attributes. The brand of the dashboard? Irrelevant. The per-call span? Everything.
Why per-call? Because aggregated metrics are like looking at a weather report that only tells you the average temperature for the month. You miss the heatwaves, the cold snaps, the storms. Per-call spans, however, allow you to ask, “What was in the prompt on the 14 most expensive calls last week?” and get a concrete answer.
The Four Culprits
1. The Infinite Retry Loop (18% Token Drain)
The first ghost in the machine? A Stripe API integration that was choking on 429 rate-limit errors during peak hours. The Stripe server had no built-in backoff, and the agent’s error handling? A stubborn retry mechanism that would attempt up to seven times within a single turn. Each retry resubmitted the entire prompt context. Seven retries on a 14k-token prompt meant roughly 100k tokens just to discover Stripe was busy. This was happening on about 30% of PRs touching payment code. The user never saw it – the agent eventually succeeded – but the traces laid bare the massive, hidden token expenditure. The fix? A simple backoff with jitter on the Stripe side and a hard cap of two retries per tool per turn. Six lines of code, and a massive chunk of the bill vanished.
2. The Contextless Re-reads (14% Token Drain)
Next up, a design choice that seemed sensible at the time: the agent re-reading its core instruction file, CLAUDE.md (a hefty 4,000 tokens), at the start of every single turn. Add in a few other supporting files, and you’re looking at 56k context tokens per PR review, when maybe only 8k were actually needed (the diff and relevant source files). Tracing revealed that the average PR review involved 14 turns, each a fresh start, re-fetching all those context files. The solution? A turn-level cache for read-only files, leveraging Anthropic’s prompt-caching API. Now, core files are read once per session and cached for subsequent turns at a fraction of the cost. This slashed token usage by 14%.
3. The Redundant Broadcast (Unknown, but Significant)
When the agent spawned three sub-agents for specialized code reviews (architect, security, performance), it was unthinkingly passing the entire PR diff to each one. A 3,000-token diff, sent to three agents independently, is 9,000 tokens of duplicate context per PR. Multiplied by 80 PRs a month, that’s a colossal 720,000 tokens vanishing into thin air – essentially wasted. The fix here is to pass only the relevant parts of the diff or, better yet, establish a shared context layer for these sub-agents, so the information isn’t redundantly broadcast.
4. The Unnecessary Re-initialization (Unknown, but Suspect)
Finally, there was the issue of sub-agents re-initializing their entire state on every single turn. Think of it like a chef meticulously setting up their entire station from scratch before preparing each individual ingredient. If a sub-agent was performing multiple distinct actions within a larger turn, it was blowing through tokens to re-establish its context and parameters each time. The solution involves architecting sub-agents to maintain state across their operational turns within a single parent turn, significantly reducing repetitive initialization costs.
“Aggregated metrics (‘avg input_tokens by hour’) would have shown me the bill going up and not why. Per-call spans let me ask ‘what was in the input on the 14 most expensive calls last week’ and answer with one query.”
The Platform Shift is Here, But We Need the Tools to Manage It
This isn’t just about rogue AI agents burning through tokens; it’s about a fundamental platform shift. AI, especially Generative AI and large language models, is no longer a niche technology. It’s becoming the operating system for countless applications and workflows. But with this power comes complexity, and with complexity comes unexpected costs and inefficiencies.
The fact that these bottlenecks were entirely invisible to standard logging highlights a critical gap. As developers and organizations embrace AI, we need more than just smarter models. We need sophisticated observability tools that can keep pace, allowing us to understand, optimize, and control these powerful systems. The ability to trace individual LLM and tool calls, to understand the context and cost of each interaction, is no longer a luxury; it’s a necessity.
The initial expectation was that AI agents would be inherently efficient. The reality, as this developer’s experience shows, is that without the right tooling and a deeper understanding of their internal mechanics, they can become expensive liabilities. This isn’t a reason to shy away from AI, but a call to arms for better engineering practices and more powerful debugging and monitoring solutions in the AI development lifecycle.
This story is a stark reminder: the future isn’t just about building AI; it’s about mastering it. And mastering it means understanding every single token spent, every tool called, and every turn taken. The AI platform shift is here, and with it comes the urgent need for transparent, traceable, and optimizable AI systems. The invoices will keep coming, but with the right insights, we can ensure they’re for work done, not for digital dust bunnies.
🧬 Related Insights
- Read more: Free FOSS Mobile Hackathon Hits Netherlands
- Read more: Grafana Assistant: AI Sees Your Infra First
Frequently Asked Questions
What does per-call tracing in AI agents do?
Per-call tracing in AI agents provides granular visibility into each individual LLM and tool interaction. It logs details like input/output tokens, tool names, durations, and errors, allowing developers to pinpoint exactly where AI resources are being consumed and identify inefficiencies, unlike aggregated metrics which only show overall trends.
How can I reduce my AI token costs?
Reducing AI token costs involves several strategies, including optimizing prompts, implementing caching mechanisms for frequently accessed data, reducing redundant information passed between agents or models, and carefully managing retry logic for tool calls. Implementing detailed tracing is the first step to identify where costs are truly occurring.
Is this a common problem with AI agents?
Yes, unexpected token consumption and hidden inefficiencies are common challenges as AI agents become more complex and integrated into production workflows. The opaque nature of LLM interactions often means that standard logging is insufficient to diagnose cost drivers, making specialized tracing tools and methodologies increasingly important.