Seven hours. That’s how long it supposedly took one user to manually reconcile stock portfolios across multiple brokers in a single month.
Seven. Hours.
Look, if you’re spending more time cleaning CSV files than actually thinking about your money, something is fundamentally broken. And usually, it’s not the data itself. It’s the duct-tape-and-wishful-thinking system holding it all together.
This is a tale of woe. A familiar one for anyone who’s ever dared to look at their finances across more than one platform. Degiro, Interactive Brokers, Binance – they all spew out data. Different formats. Different tickers. No fundamentals.
And crucially, they don’t talk to each other. A recipe for a Sunday night spreadsheet apocalypse.
The problem isn’t a lack of data. It’s the sheer, unadulterated friction of aggregating it. Renaming columns. Fixing dates. Guessing what AAPL.US means when your other source just says AAPL. Two hours of drudgery just to get usable data, which is already out of date by the time you’re done. And don’t even get me started on trying to bolt on fundamental metrics. Separate lookups. One ticker at a time. Maddening.
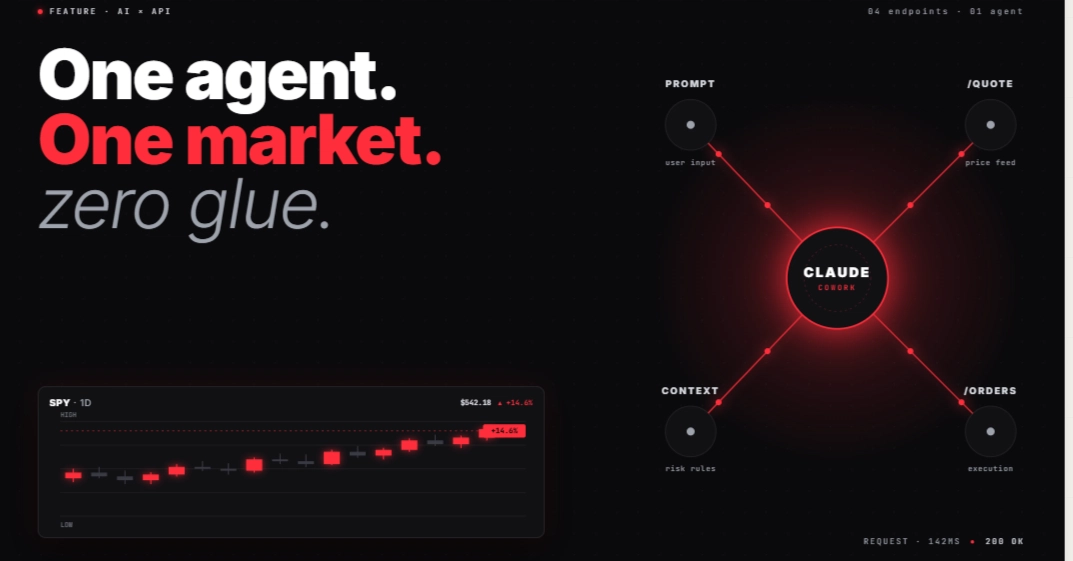
The author of this workflow, bless their data-weary soul, had enough. They ditched the spreadsheet obsession and rebuilt from the ground up. The heroes? Claude Cowork and the EODHD API. One for the messy human layer, the other for the clean data layer.
The Human Layer: Claude Cowork to the Rescue
Anthropic’s Claude Cowork. It’s not just a chatbot you ping for code snippets. This thing actually runs code. And it’s good at reading files. Really good.
You drop your broker exports into a folder. Cowork dives in. It understands the distinct schemas. It normalizes column names. It standardizes tickers – no more AAPL vs. AAPL.US headaches. It merges it all. Buys, sells, dividends, fees – it categorizes it. This used to be a two-hour ordeal. Now? Under five minutes. No manual cleaning. No pre-scripting.
Describe the task: “Normalize these three broker files into a single DataFrame with columns: date, ticker, operation, quantity, price, broker.” Cowork writes the Python script. It runs it. If it breaks – a date parsing error, a ticker mismatch – it fixes it. On the spot. That’s not just automation; that’s intelligent automation.
The Data Layer: EODHD API Delivers the Goods
Once your trades are clean and unified – a single CSV, no less – it’s time to inject some actual intelligence. That’s where EODHD comes in. This API plugs in the data your brokers conveniently left out. Think end-of-day prices, historical performance, fundamental data like P/E ratios and EPS, market cap, sector info. And crucially, dividend details. Forward-looking dividend dates and amounts.
EODHD is no slouch. Over 70 exchanges. 150,000+ tickers. Consistent JSON responses. One API key. One endpoint structure. Everything you need, presented cleanly. The script iterates through your unified ticker list, pulls the relevant enrichment data, and merges it back in. The result? An enriched_portfolio.csv that’s actually useful.
This enriched data then feeds a local dashboard. Plotly, or whatever your preferred CSV-gobbling visualization tool is. Every run refreshes the dashboard. No more open tabs. No more Sunday night data cleanup rituals. Just a single tab on Monday morning. Bliss.
Why This Matters: The Death of Spreadsheet Debt
This isn’t just about saving a few hours. It’s about escaping the insidious trap of spreadsheet debt. Every time you manually merge, clean, and look up data, you’re incurring debt. It’s a time debt, a cognitive debt, and often, a financial debt when bad data leads to bad decisions.
This workflow is a powerful counter-argument to the idea that sophisticated financial analysis requires a dedicated data engineering team. It doesn’t. It requires the right tools and a willingness to automate the mundane. Claude Cowork and EODHD offer a compelling blueprint for how an individual, or even a small team, can build a strong, automated financial data pipeline without breaking the bank or their sanity.
It’s a quiet revolution. One that trades endless clicking and manual data entry for intelligent automation. And frankly, it’s about time.
What About My Old Data?
The beauty of this approach is its scalability. Once you have your broker exports feeding into Cowork, and Cowork feeding into EODHD, you can easily backfill historical data for performance attribution. Pulling historical price series and past dividend payments becomes a straightforward addition to the enrichment script. The dashboard then reflects not just your current holdings but their entire history, analyzed with consistent, up-to-date fundamentals.
🧬 Related Insights
- Read more: GitHub’s ‘Poor’ Uptime: The Hidden Strength in Frequent Outages
- Read more: AI Builds Blog: Claude Code Saves 30 Hrs, No CMS Hassle [Deep Dive]
Frequently Asked Questions
What does Claude Cowork actually do for my investment data?
Claude Cowork automates the process of reading, cleaning, and unifying messy data from different broker export files. It normalizes formats, standardizes tickers, and categorizes transactions, saving hours of manual work.
Can EODHD provide real-time stock prices?
EODHD primarily provides end-of-day prices and historical data. While they may offer real-time data through specific subscriptions or APIs, the workflow described focuses on EOD data for portfolio enrichment and analysis.
Is this setup complicated for a non-developer?
While it involves scripting, Claude Cowork’s ability to generate and debug code based on natural language descriptions significantly lowers the barrier to entry. The EODHD API is also designed for relatively straightforward integration, especially with Python examples provided.